

Psychologically-Significant Levels Could be a Trojan Horse
The Dow, S&P 500, and Nasdaq have all cleared round-number levels recently

I confessed this earlier in the spring, but I failed Microeconomics in college.

I was always decent at math growing up; AP Calculus, above average standardized test scores. I swaggered into my liberal arts school hoping to major in economics. After a B in Econ101, I followed up Microeconomics with a big fat F.
Maybe it was the Natty Light talking, but it was all hieroglyphics.
Not even a 100 on the final would have saved me. I wore that F like a scarlet letter for almost 10 years post-grad. I’d be lying if I said it wasn’t a major limiting belief when got the editor job here at Schaeffer’s. Irony abound.

How would a writer by trade survive with all these numbers?
After nearly 10 years here, one will mistake me for Niels Bohr, but I can hold my own now. How did I shake off the imposter syndrome? Keeping it simple, dumbing it down, and letting patter recognition shine.
Despite all the daunting equations, formulas, and algorithms out there investors are inundated with, I was shocked to see that there’s just as much an emphasis on digestible round numbers.
Senior V.P. of Research Todd Salamone has repeatedly hammered home their psychological significance in his Monday Morning Outlooks, to the point that it’s the first thing I look at every morning. Here’s a recent example from early May that proved prophetic:
A potential resistance area could be in the 7,500-7,530 area. The 7,500 mark is a clean round number …
Round-number percentage levels often represent hesitation or pivot levels, and there is likely a psychology around this phenomenon.”
The psychological impact of these numbers can cut through a lot of noise. They can alternate between resistance and support in the blink of an eye.
They’re chicken noodle soup for my liberal arts brain. They’re like earned run average (ERA) for a pitcher; it doesn’t tell the whole story, but you get enough of an actionable gist.
Looking around Wall Street right now, there are a lot of round numbers in play.
The Dow ever so briefly toppled 53,000 last week and has since moved lower to consolidate below this level.
The Nasdaq cleared 27,000 back in early June and is now coiling around 26,000 amid the ballyhooed AI infrastructure selloff.
The S&P 500 vaulted past 7,600 in early June and now is testing 7,500.
The small-cap Russell 2000 (RUT) had a cup of coffee above 3,000 before ceding this level.
Gold and 4K are doing their dance.
Are these round-numbers really indicators of future market performance? If the psychology is to be believed, once these levels are cleared on a closing basis, we’re off to the races, right? It’s getting past them the first time that’s the challenge.
I tapped Senior Quantitative Analyst Rocky White to look at the history of the three major indexes crossing over psychologically-significant, even-1K levels.
The Dow
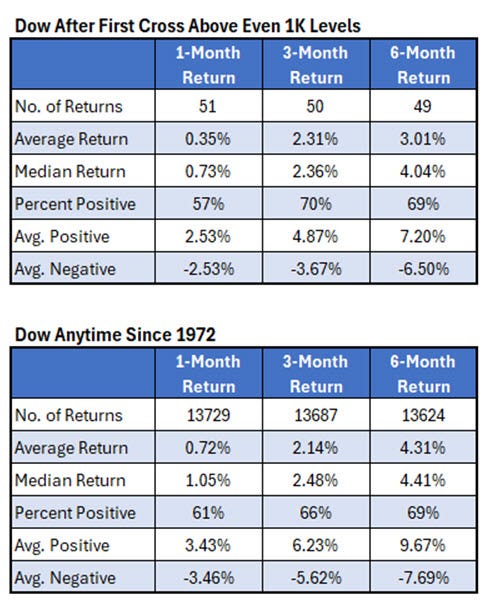
For the Dow, I looked at 1,000-point intervals. The number of returns are different because we just crossed 52K in the last month, and that data obviously isn’t available yet.
Overall, looking at average return, one-month timeframes show crossovers underperform compared to anytime returns, while three months out, crossovers tend to be slightly more bullish. Not a huge trend worthy of a jailbreak. Six months later, crossovers underperform again.
Narrowing the scope a little to 2021, there is some serious underperformance.
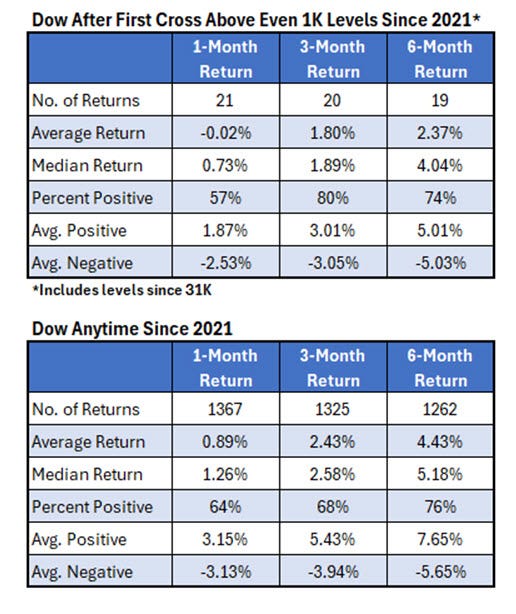
There have been 19 crossovers, and the Dow underperformed anytime returns across one-, three-, and six-month timeframes. The percent positive of crossovers is steady, indicating a sort of lack of upside , a pause in the post-Covid era when these milestones are cleared. These levels are certainly barriers for the Dow, magnets with a pull that can be hard to separate from.
The Nasdaq
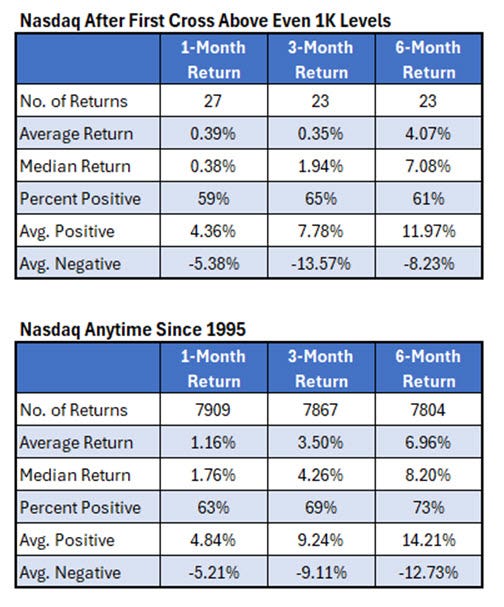
More 1,000-point intervals here. Clearing 1K levels has been tough sledding for the Nasdaq, with only 23 instances going back to 1995. Once more, there’s clear underperformance after the first crossover compared to average anytime returns, even this time with percent positive. For the Nasdaq at least, these levels aren’t milestones, they’re psychological hurdles and profit-taking levels.
The S&P 500
The SPX tells a different story than its peers.
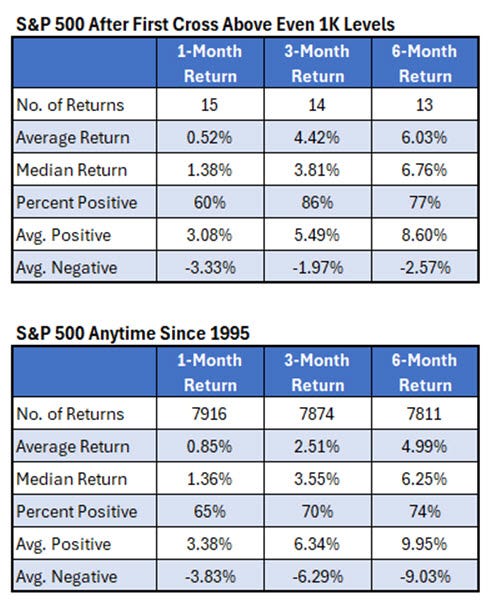
Round-number crossovers yield slight underperformance in the short term, but that pivots to a pretty stark outperformance across three- and six-month returns. For some reason, crossing these levels over are less of a psychological barrier than the Dow or Nasdaq.
White conducted a similar study back in January for his Indicator of the Week. The only difference was he ran the study for the Dow and S&P 500 getting within 1% of 10K increment levels, not crossing them.
Historically, the index has struggled immediately after approaching these even levels but quickly regains momentum and outperforms over the longer term …
History shows these even levels have done nothing to slow the SPX in the longer term and may even be a catalyst. There were 13 previous signals with a one-year return (two signals have occurred within the last year) and every one was positive with an average return of over 16%.
The results were similar though; the Dow showed weakness heading to 10K increment levels, while the SPX barreled on through with solid average returns.
White speculated that the blue-chip Dow being referenced more often made those psychological areas more of a pain point.
My theory is simpler; 53,000 and 26,000 are larger, scarier numbers than the S&P 500 at 7,500. Whatever the reason, if you’re just starting to read the market tea leaves or are looking to declutter your macro analysis, keep it simple with psychology.
The Russell 2000
I wanted to also quickly hit small caps.
After July 1, the RUT has spent the month sulking below 3,000. The journey past 2,000 was one worthy of a poem from Homer; the small-cap index spent 2022–2025 chopping right around 2,000, crossing back above and below that level 25 separate times.
Filter it down to clearances (first close above after spending two weeks below), and here are the average returns of the six instances:
1 month: -2.4%
3 months: ‑4.5%
6 months: +4.2%
Accounting for round-hundred crossovers for the first time, there have been five since 2021.
1 month: -2%
3 months: -1.6%
6 months: -4.3%
Cracking open the tape shows that most of these negative returns were skewed by some awful broader underperformance in 2021. And for what it’s worth, the one-month returns after the RUT conquered 2,800 and 2,900 in May have been positive, with 3% returns.
It’s clear then that there’s no waved checkered flag for crossing a round-number level. If anything, these psychologically significant areas are the sacking of Troy.
A Trojan horse, if you will.
Once they’re cleared, the real Odyssey begins.
I may be better at math, but I’m a liberal arts guy through and through.
It's great to see your passion for the markets shine through despite whatever may have obscured your economic prowess back in Micro class. Your pride in the liberal arts is also noble. The Princeton Review reports that students at Centre College study harder than at any Ivy League school, which helps to explain both the challenges and the pride. May your stock continue to rise!